
Andrew Jesaitis


In late 2013, Golden Helix started development on a new desktop tool called VarSeq. It aimed to solve many of the difficulties both researchers and clinicians experience when analyzing Next Generation Sequencing (NGS) data. It is intended to be used to analyze the output of a bioinformatics pipeline and relies on VCF files as its input.
I took on a broad leadership role in the project. I worked both as a Product Manager and as a Developer.
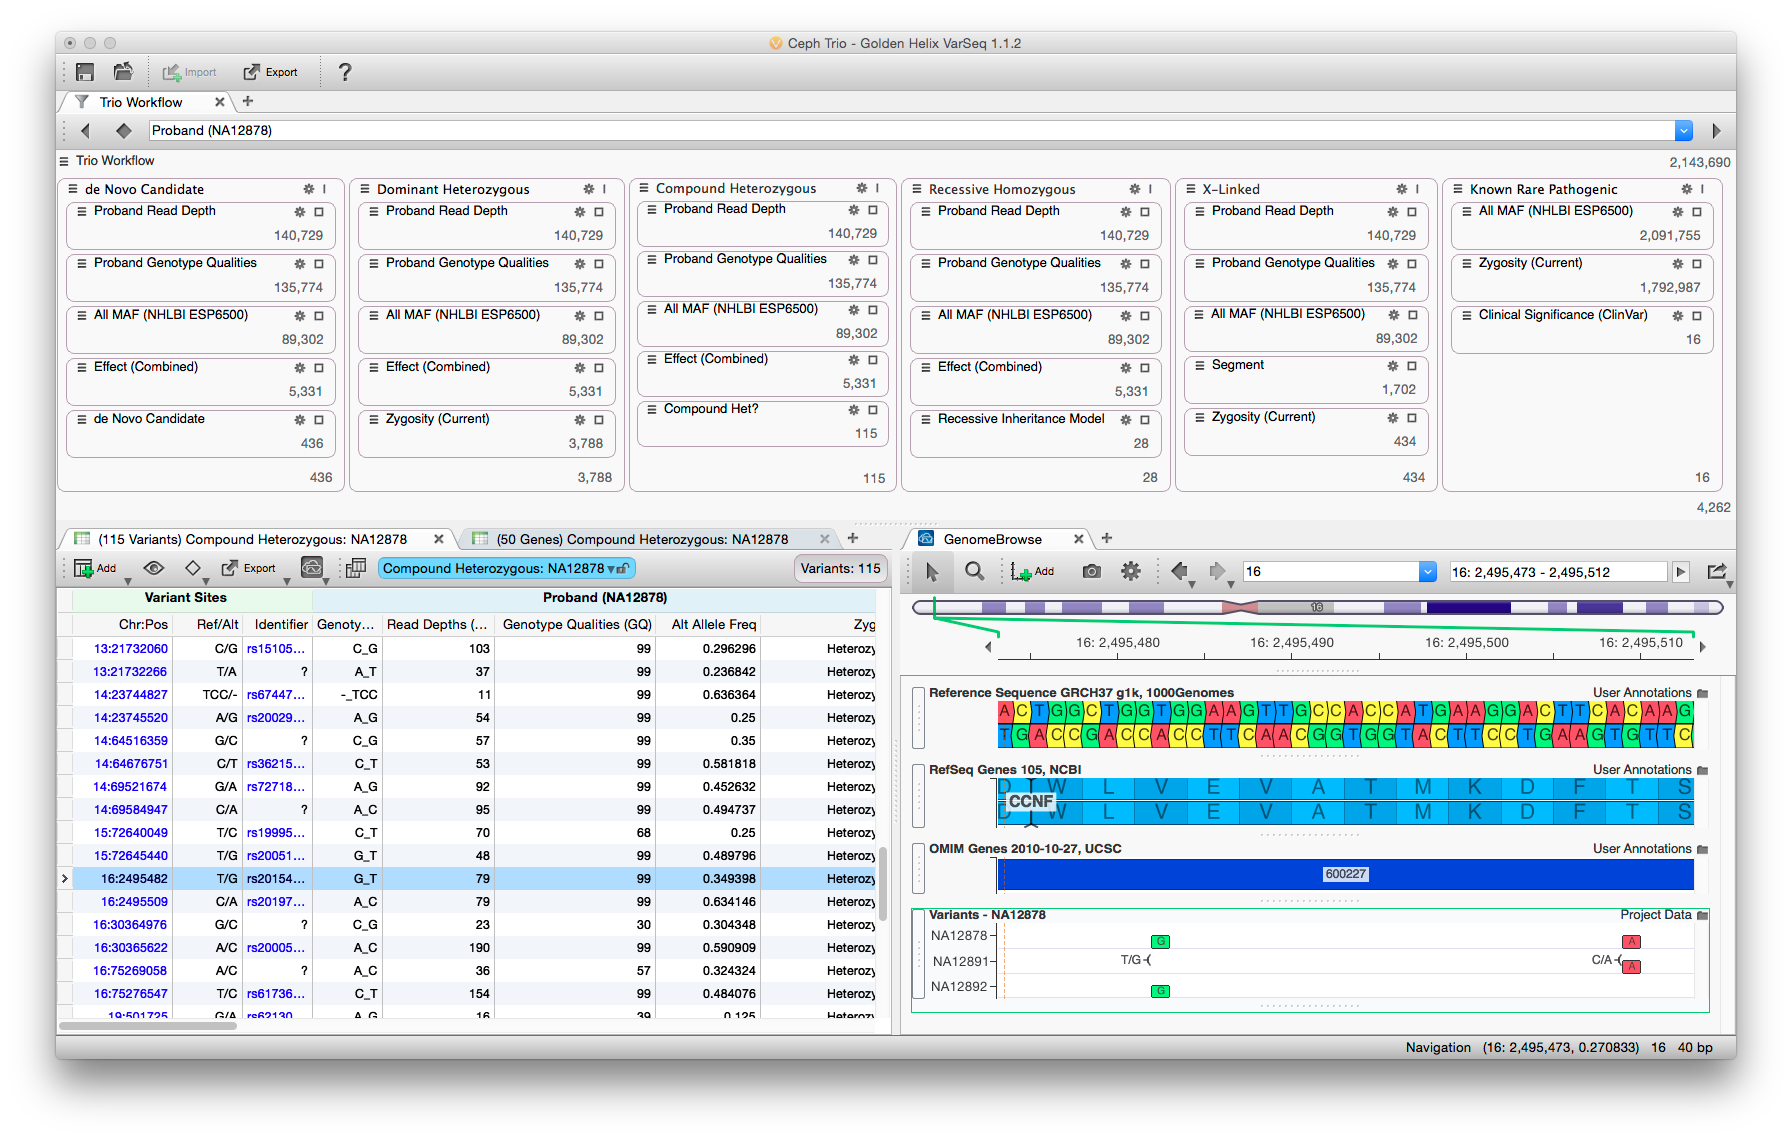
The VarSeq user interface balances data density with usability. Rare variant analysis can be very complex, but by partitioning the filter chain and providing immediate feedback analysis can be performed rapidly.
As Product Manager I was responsible for generating feature-level specifications through interactions with a variety of stakeholders. Additionally, I would work with a software architect to scope and produce technical specifications. Working with the project’s team of developers, I was then responsible for the creation of the product’s roadmap and development time line. As development moved forward, I communicated the development team’s progress with sales, marketing and management.
When possible I worked as a developer on the project implementing key features. Maintaining a deep understanding of the technical underpinnings of VarSeq allowed me to be aware of what was easy, what was possible, and what was infeasible. This understanding helped to guide stakeholder conversations and prioritization of features during roadmap planning.
One of my primary responsibilities on VarSeq was to develop the analysis workflows that ship with the software. By default, VarSeq ships with three workflows to apply to data – cancer gene panel, hereditary gene panel, and a rare disease workflow to be applied to whole genome or exome data. The goal of these templated workflows was to give the user a starting point for analysis which delivered good results across a wide range of input data. Additionally, these templates should be easily understood, so that users can extend and refine them to suit their individual needs.
Stakeholder interviews drove the development from start to finish. A variety of users were recruited and interviewed about their analysis workflows. Representative personas were constructed (bioinformatician, clinician, researcher, student). Additionally, the common elements from each analysis type were combined and filters were created to encapsulate the users’ logic. These “filter chains” were mocked up and each user was interviewed about the proposed elements. The filter chains were revised and implemented as prototypes in an early version of the software. Users were again interviewed while they used the software. Their feedback drove additional revisions to both the individual filtering parameters and the user interface used when running and customizing the analysis. Another round of prototyping was performed with users before the designs were finalized.
Each analysis type has a different objective and a different target user. For example, gene panels are often analyzed by less experienced personnel who have very strict parameters surrounding what variants are to be reported. Thus, the filter chain in this case consists of very simple filters that do little in the way of inference. These workflows removed variants of poor quality, those outside of target amplicons, and those that do not alter the protein sequence. The remaining variants are displayed in a very straight-forward manner grouped by gene.
This contrasts with the rare disease template, which applies many filters both in sequence and parallel to look for variants by inheritance type. Whole exome and genome sequencing is often performed by a very seasoned users who understand the trade-offs as filters perform more inference during analysis. A good example is looking for compound heterozygous mutations. It is too computationally expensive to examine all the pairs of variants on each gene. Therefore, deciding when to apply this filter is critically important. From our interviews, it is usually common to apply it after common, low quality, and non-deleterious variants have been removed. Additional since these users are more experienced, the data density is also much higher in this analysis template.
Effective workflow and user interface design are critically important in scientific software. Maintaining clarity and simplicity, while not losing power-user features was my prime consideration as the Product Manager of VarSeq.
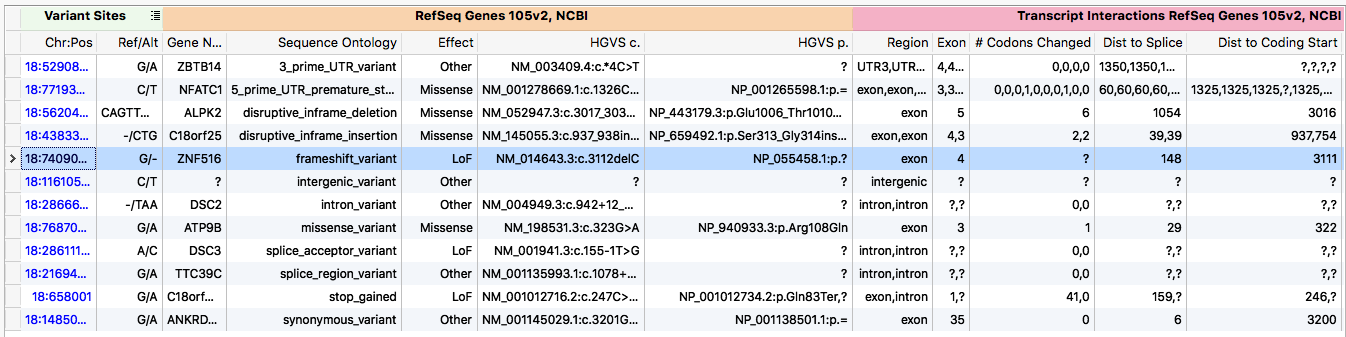
Example transcript annotation output
A key piece of any NGS workflow is annotate each variant against the transcripts it overlaps. However, the term annotation is a misnomer for what this process entails. A more descriptive term is model-free variant effect prediction.
A single genetic variant can be predicted to have a multitude of different effects depending on which transcript is used to make the prediction. A gene often is modeled as a set of transcripts. Each of these transcripts may have different coding regions. Thus, in one transcript the variant may only impact a non-coding, intronic region, while in another it creates a premature stop codon. The biological consequence of these effects is substantially different. One of the central problems faced during development was how to present these varying effects to the user.
The algorithm followed the general form of a production system, where inferences from the genetic variant are made. Generally the inferences were ordered in increasing computational complexity, such that once a sufficient number of inferences were made the algorithm would kick out the ontology. For example, the algorithm first checks to see if the variant overlaps any transcripts. If not, the algorithm terminates early and labels the variant as intergenic. If however, the variant does overlap a transcript, the algorithm then checks for an overlapping exon. Finding one, it checks if it is coding. Seeing that it is coding, the amino acid change is calculated. Then the variant would be classified as synonymous or non-synonymous. This process continues until the classification is unambiguous (as encoded by termination points defined by sequence ontology database).
In order to provide clinicians and researchers with other pertinent data that was produced during the classification process, the algorithm saves intermediate inferences. Thus, it can inform the user of statistics such as percent of coding sequence truncated.
The algorithm was designed from the ground up to only make the minimum number of required calculations to return the data requested by the user. If the user is only interested in exon number, no computations to determine sequence ontology will be performed. This architecture allows the algorithm to be run in an on demand fashion.
Finally, in order to ensure correctness and maintainability an extensive set of unit and integration tests were written for the algorithm. These tests consist of a hand curated set of simulated variants designed expose known trouble spots for variant classification such as splicing variants.
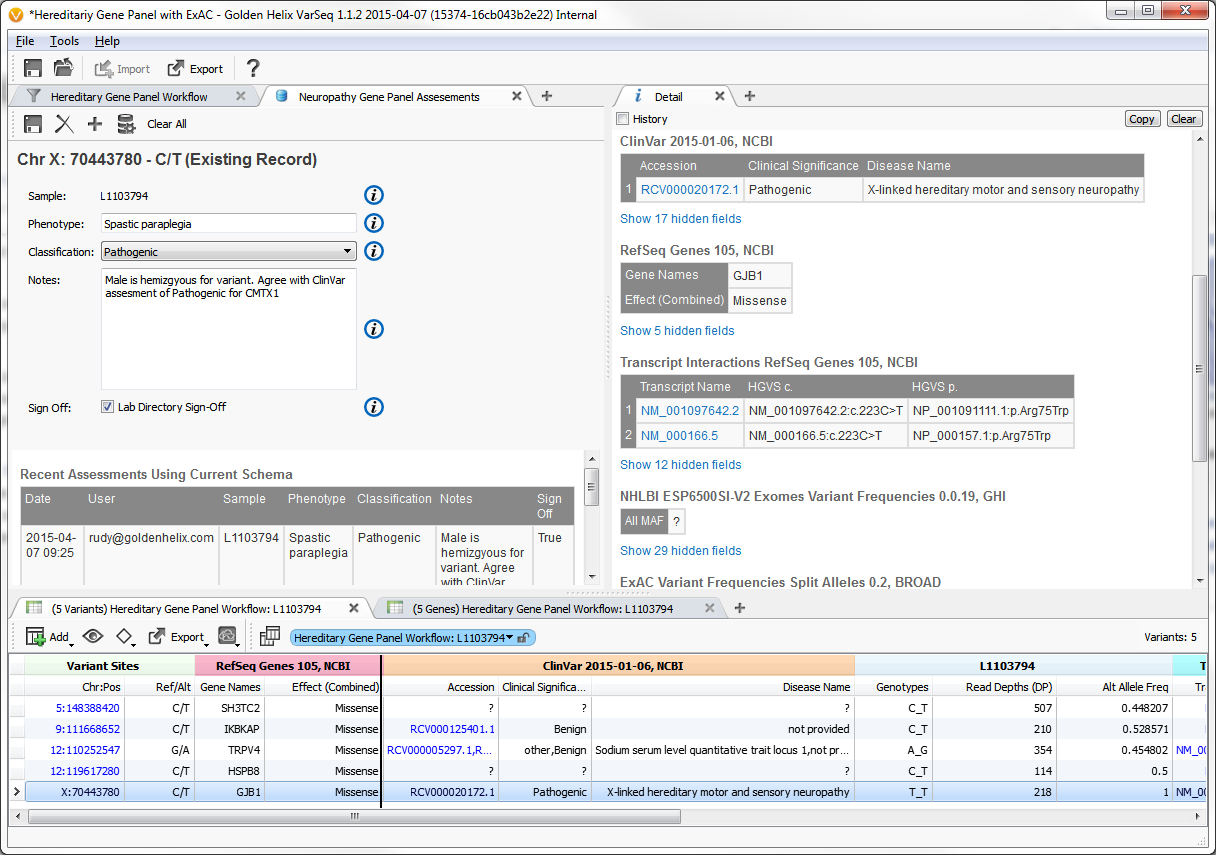
Example input screen to variant assessment database
From the earliest stakeholder interviews, it was apparent that users need a way to way to track their variant observations across projects. To meet this need, we developed a variant assessment database.
In addition to defining the feature level specification, I worked on the front-end implementation of this feature. The key aspects of its functionality were:
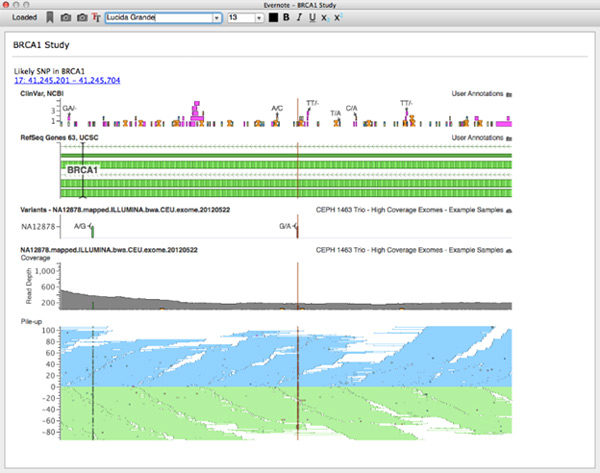
Evernote client integrated in GenomeBrowse
I am a huge Evernote user. For my money, nothing beats free-form notes with a screenshot or two to help you remember the context you were using when returning to a project. To make this context gathering easier we integrated Evernote directly into VarSeq and GenomeBrowse.
For this project, I worked on backend due to an interesting way the Evernote API is exposed. The main API to Evernote is in written in JavaScript. There actually is a C++ implementation, but it requires Boost libraries and our stack is based on Qt. So the best way forwarded was to wrap the JS api in C++ (I know, crazy!). It turns out this is actually relatively easy in Qt. This was accomplished by using Qt’s WebEngine as a JS execution environment. Then each call (and any dynamic processing) was wrapped by a C++ hook. In the end we created an Evernote client that exposed all basic functionality (login, notebook selection, text editing, etc) that was embedded in a cross-platform desktop application.
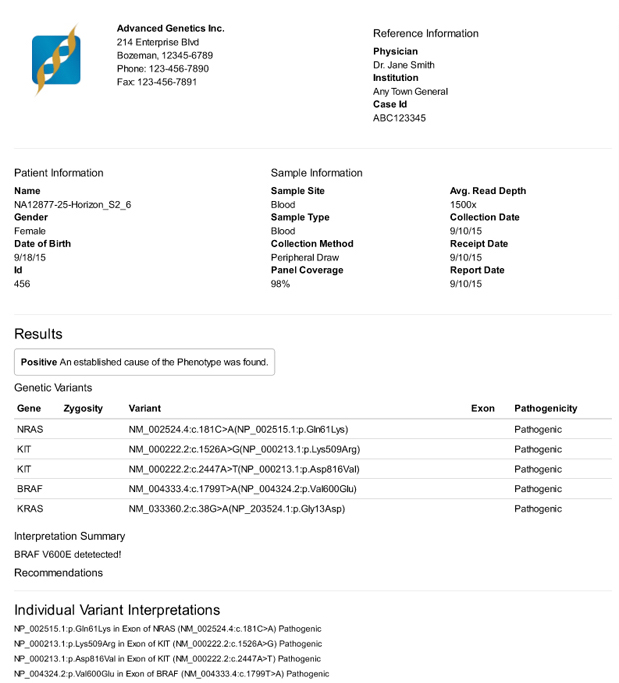
A clinical report produced by VarSeq rendered to PDF
VarSeq also includes the ability to create clinical grade reports. Over a period of months, I talked with stakeholders about the design of their current reports. I also gained an understanding of how report generation was currently integrated into their analysis pipelines. Once these conversations were crystallized into specifications, I worked as the lead front-end engineer for this project. The goals of the reporting engine were three-fold:
Here I leveraged technology built in previous projects – specifically the dynamic form interface from the variant assessment database and the use of Qt’s WebEngine used in the Evernote integration. The finished product allows an end user to define their input form programmatically in JSON. This definition is bundled with data processing code written in JavaScript and a Handlebars template. This package forms the core of a WebApp that is executed in a pseudo-server/client context. Qt’s WebEngine acts like a “server” execution environment. The produced HTML is then handed to a WebKit frame where further rendering can take place on the “client”. One nice byproduct of this architecture is that it makes the module easily extensible into a more traditional WebApp execution environment.
The final report’s customizability is only limited by the WebEngine/WebKit implementations used by Qt. In fact, the final output is not restricted to HTML. I built a prototype integration using XML as API interface layer for communication with another provider.
The clinical reporting feature completed a VCF to PDF pipeline that was desperately needed by many labs.