
Andrew Jesaitis


For a while I’ve been curious to see if there is any effect on a backwardated term structure in VIX Futures on future returns in the SPX.
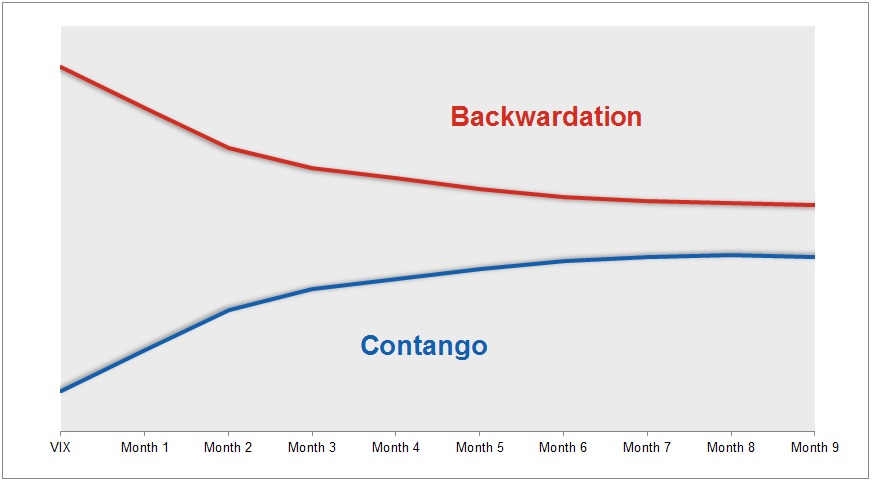
Example of a generic futures curve in contago and backwardation. (from CBOE Options Hub)
The VIX measures the price that traders are willing to buy options to protect their portfolio. The spot VIX measures this price. You can buy futures on the VIX. Essentially you are making a bet where the VIX will settle on the date of expiration of the VIX future contract. At settlement you get paid the amount your future is worth. Thus, the futures trade off the price that traders think the index will be at settlement. In times of stress trader run to buy options, pushing the VIX up. Since the VIX is mean reverting this will pull the front month up more than the back month since traders figure that over time the VIX will return to is average levels of about 20. This term structure where the front month is greater than the back month is referred to as backwardation.
However, the “natural” term structure for VIX Futures is contango since they are somewhat tied to the price of SPX options which are naturally more expensive further out in time since there is more uncertainty in the future (even adjusted for time) – this is why back month options trade at a higher vol (usually) than front month options.
During big down drafts we see the VIX future curve go into steep backwardation.
Does this backwardation happen quickly enough into the draw down to get you out?
Head over and check out the iPython Notebook if you are curious about the analysis.
I computed the rolling returns for 1, 5, 10, 30, 90, and 250 day periods. They results are similar so let’s concentrate of the 10 day and 1 month timeframes since these are most relevant to the options trader.
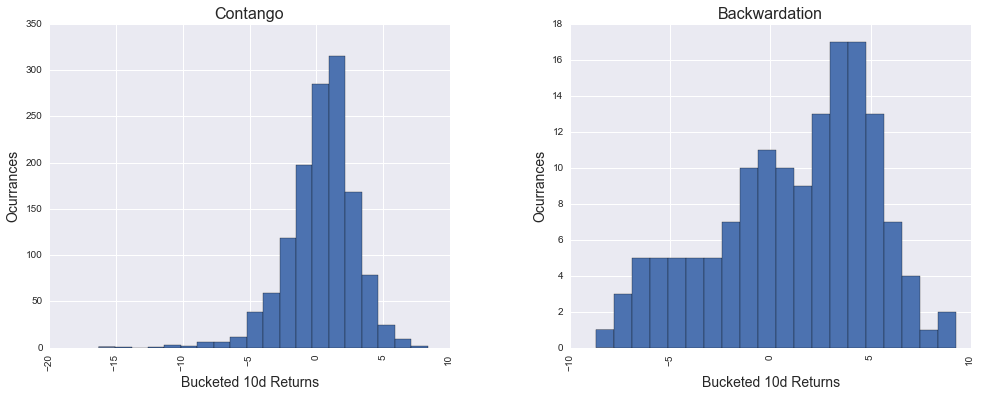
Histogram of 10 day returns in periods of contago (left) and backwardation (right).
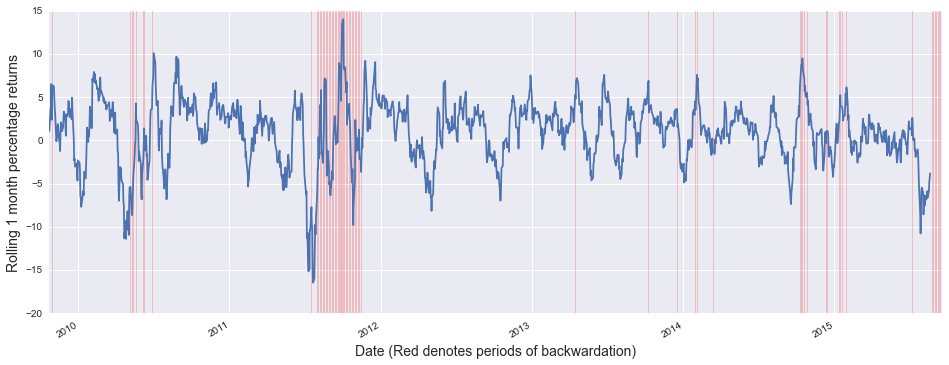
Ten day rolling return of the SPX. Periods of VIX Backwardation are highlighted in red.
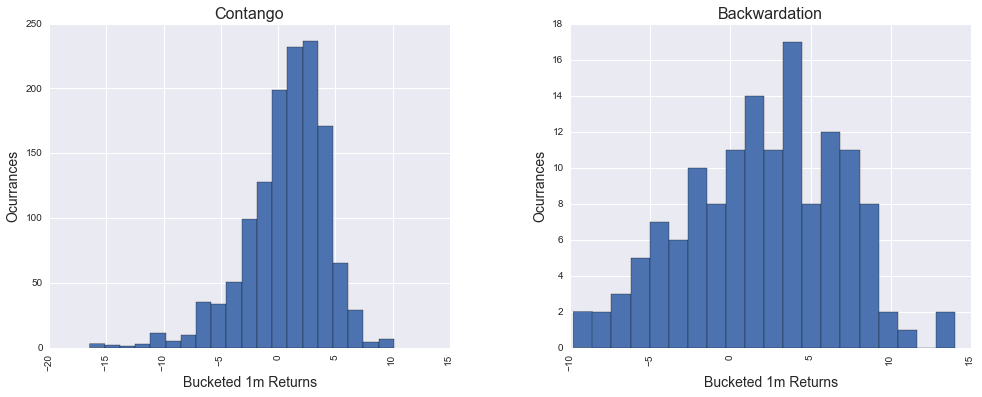
Histogram of 1 month returns in periods of contago (left) and backwardation (right).
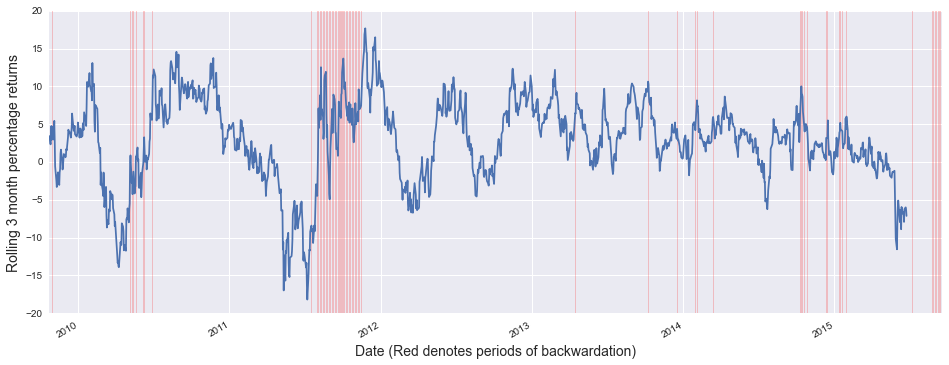
One month rolling return of the SPX. Periods of VIX Backwardation are highlighted in red.
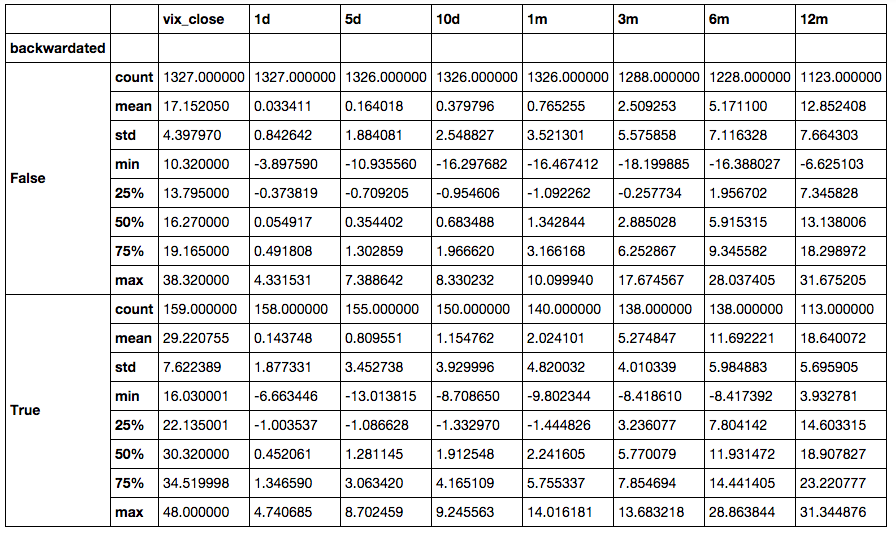
Summary of return data, segmented by VIX Term Structure.
###So what did we see?
When the term structure of the VIX is backwardated we see average returns across all time frames actually increase! But, we also have a greater dispersion. This is pretty much a given, since when the VIX is backwardated the Vol level is elevated. We could show this is the case with a correlation analysis, but if you trade you already knew this.
Basically, this means it is a useless signal for the long-only equity trader. You might think that it’s actually a inverse signal, but buying the wrong downdraft (i.e. 2008) and you don’t get to play again.
For the options trader the question is more complicated since options are much more expensive during these periods, but the moves are much bigger too.
The main problem is that that data set for VIX futures is just too small! We only have ~150 days of backwardation in the last 6 years. It’s hardly enough to go on.
I’ll be honest. I’m a premium seller and I’m nervous opening new positions right. Part of me says that this hesitancy is why these trades will pay out. So I’ll probably sell some SPX strangles tomorrow, small.
That said, I’m still curious how returns would compare between the premium seller who goes flat during backwardation and the guy who holds on. My guess is that over this data set (2009-present) the guy who held on killed it. But, that same trader would have gotten killed in 2008-2009. I might try to model this using the buy-write index, so be on the lookout for that.
I’d also be curious to segment out the data with respect to the steepness of the curve (i.e., how are return when we are in 1% contago vs -5% backwardation vs 10% backwardation), but honestly you can’t draw any good conclusions with this small dataset, so I’ll skip it for now.